
Finland and Sweden applied very different strategies to combat the coronavirus this past spring. Regardless of this, GDP has developed surprisingly similarly in both countries.
Writers

Jenni Kellokumpu
Senior Economist, PhD
Monitoring and Oversight

Matthias Strifler
Senior Economist, PhD
Monitoring and Oversight
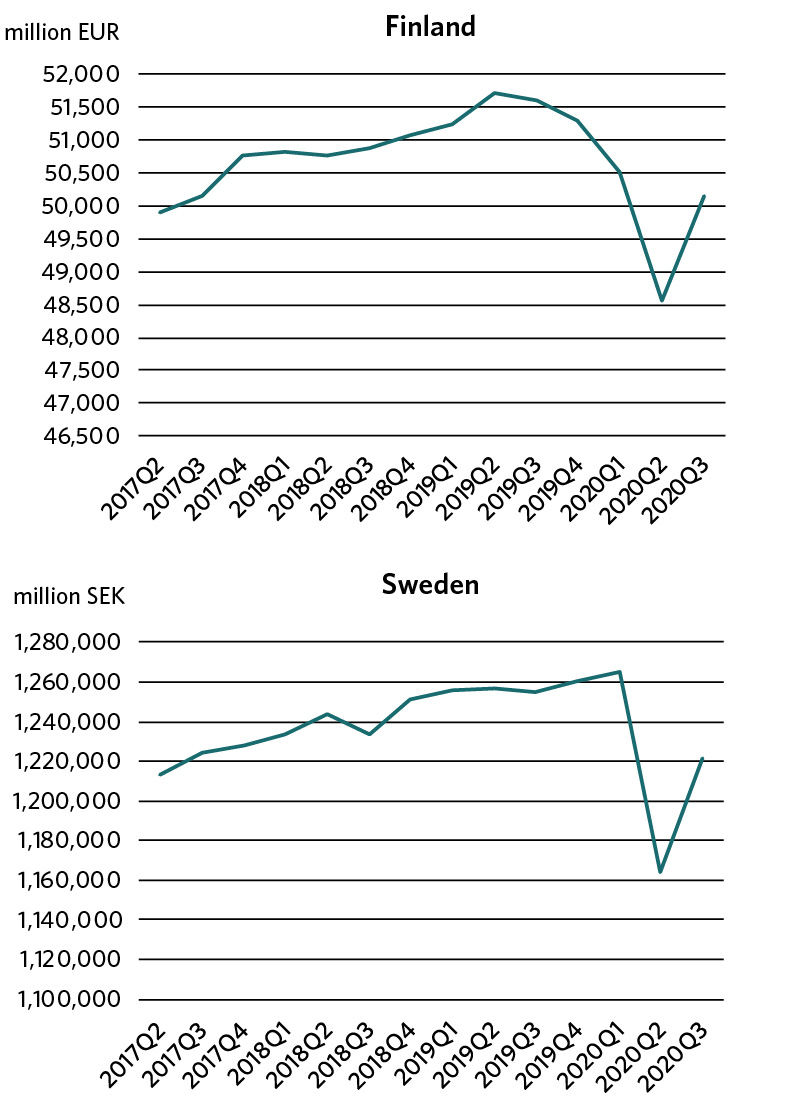
In Finland, GDP has fallen considerably as a result of the corona crisis, although the Government has managed to mitigate the harmful economic impacts of the recession. In Finland, the volume of GDP decreased by 3.9 per cent from the previous quarter, while in Sweden, it declined by 7.1 per cent[1]. Thus, Finland seems to have survived the corona crisis with smaller damages than Sweden.
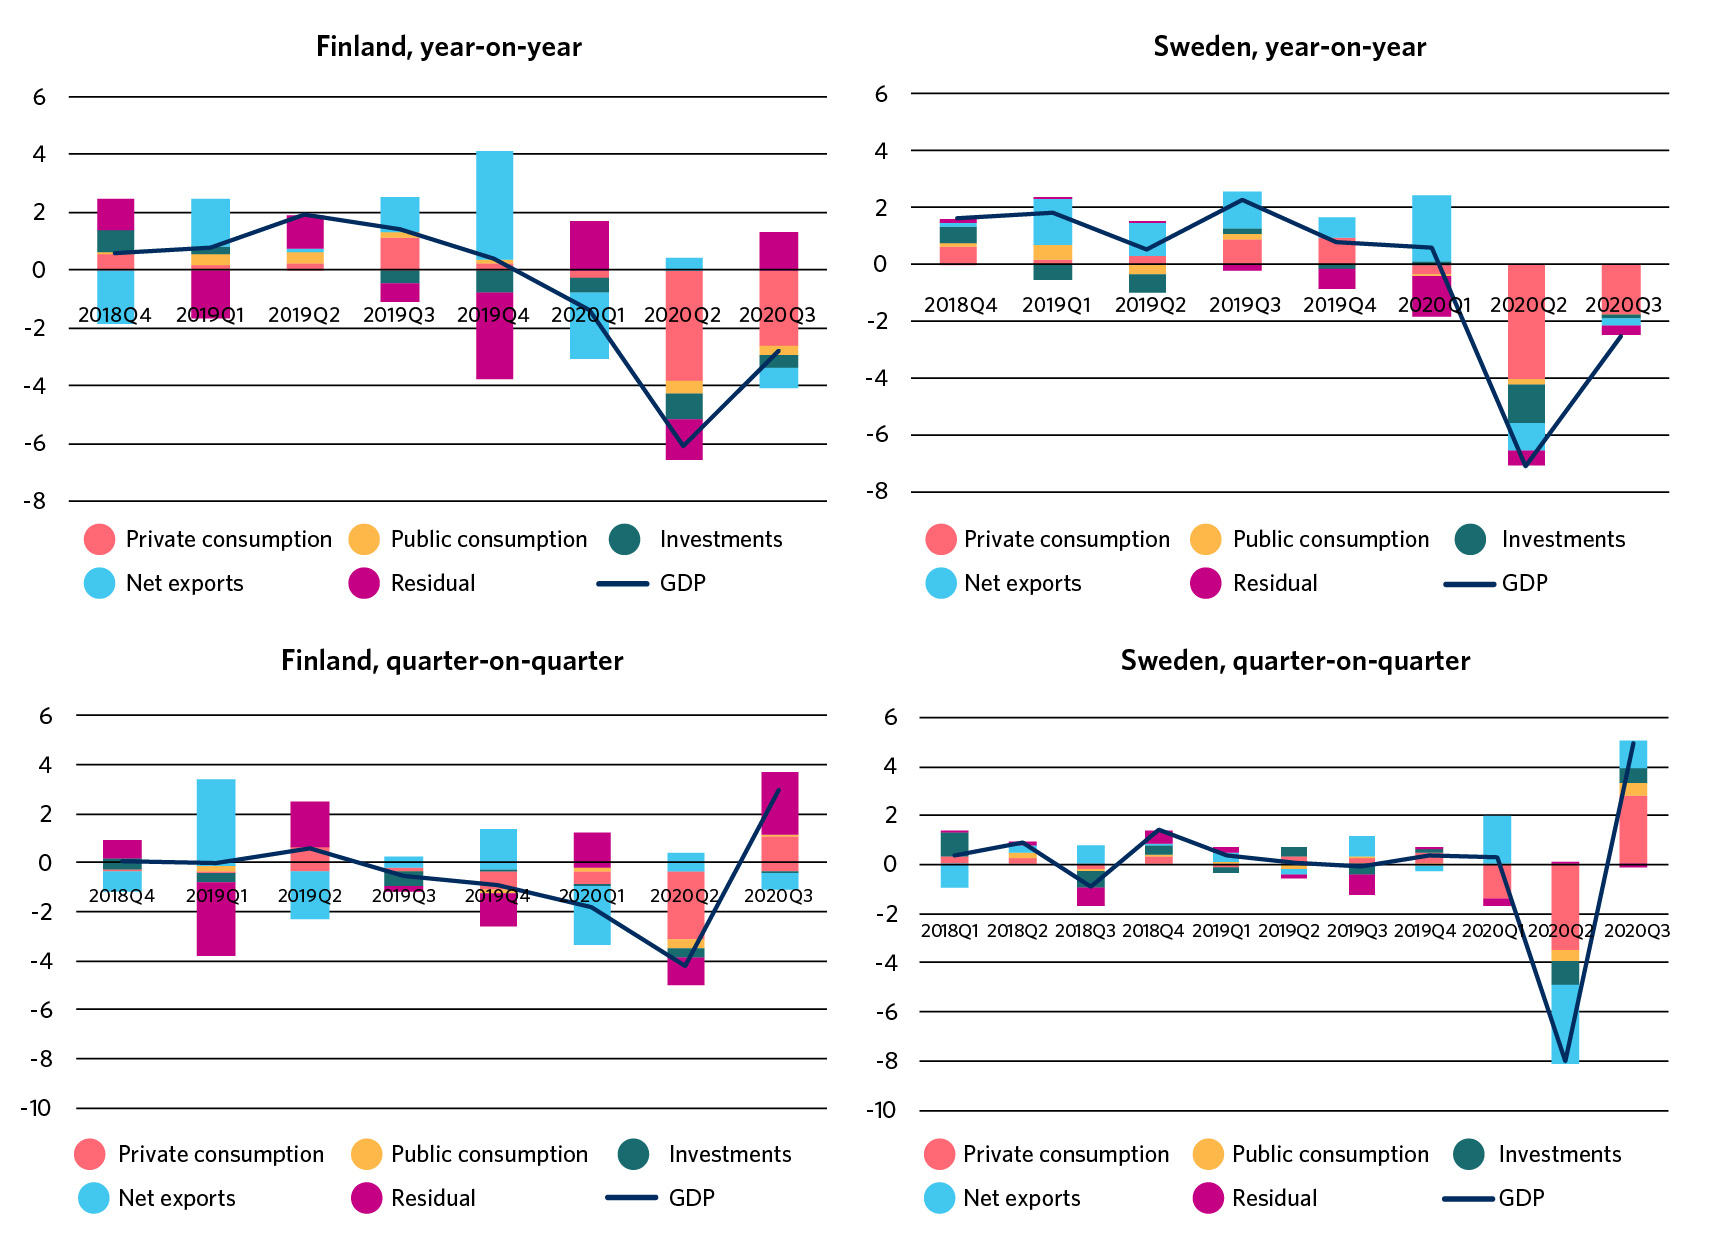
However, comparing successive quarters does not disclose everything about the overall economic development. In Finland, the economic downturn started already before the corona crisis, whereas the Swedish economy continued to grow until the coronavirus spring. Therefore, the quarter-on-quarter drop in GDP between April and June was sharper in Sweden than in Finland. In year-on-year comparison, in turn, the contraction of GDP has been of the same magnitude in both countries: in Finland, 6.1 percent in Q2 2020 and 2.8 per cent in Q3, and in Sweden, 7.1 per cent and 2.7 per cent, respectively (see Figure 1).
Sharp contraction of private consumption caused GDP to collapse in both countries
The most significant individual factor having on impact on the decrease in GDP in both Finland and Sweden is the contraction of private consumption (Figure 2). During the corona crisis, the contraction of private consumption has been almost similar in Finland and Sweden but slightly more pronounced in Finland.
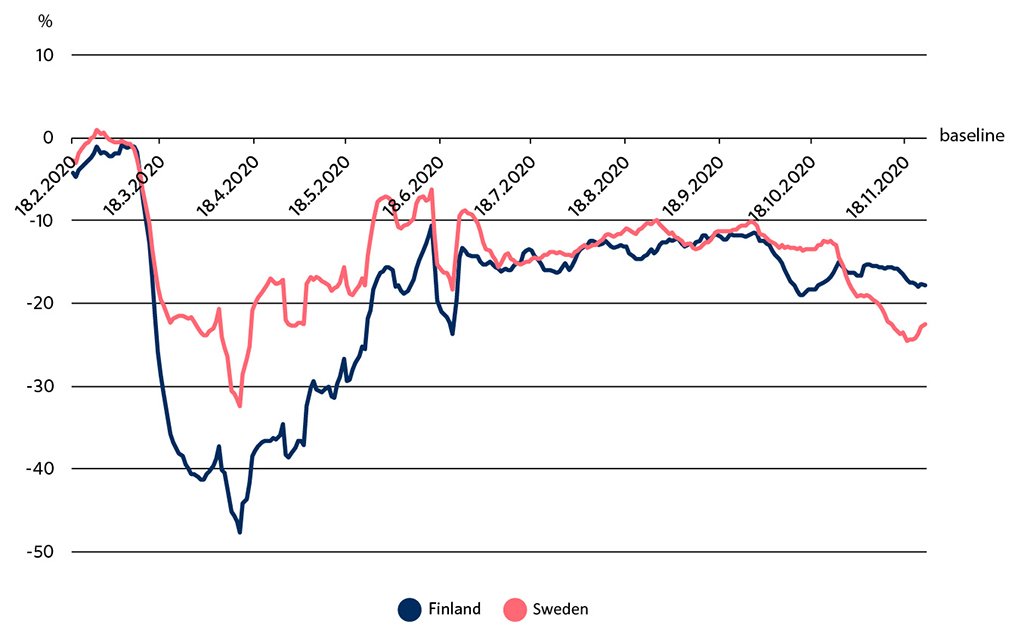
The contraction of private consumption is almost fully attributable to the decline in the demand for services. Consumption of services requires people to meet physically more often than in the case of other consumption items, which in turn requires mobility. Google’s Community Mobility Reports[2], for example, make it possible to examine how mobility has changed in different countries during the corona crisis.
At the National Audit Office, we have compiled a consumption-related mobility index, which utilizes Google’s mobility data in places where services (and goods) are consumed[3]. When the first coronavirus wave hit, consumption-linked movement decreased far more in Finland than in Sweden (Figure 3). In addition to people’s cautiousness and the threat posed by the coronavirus disease, this was probably due to the more stringent restrictions introduced by Finland[4]. The more stringent restrictions introduced in Finland succeeded in preventing the spreading of the virus in the past spring but naturally also caused the consumption of services to contract slightly more here than in Sweden. However, the difference can be considered relatively small.
Investments have also contracted in both countries during the corona crisis. However, in Finland, the negative development had already started before the crisis. In Sweden, in turn, the negative impact of the coronavirus on investments is more pronounced, as investments had remained almost stable before the corona crisis. Investments have recovered from the corona crisis more rapidly in Sweden than in Finland. This may be attributable to the quicker restoration of both the business sector’s and consumers’ confidence in the national and international economic development in Sweden.
Net exports contributed to the slightly smaller contraction of GDP in Finland than in Sweden at the beginning of the corona crisis. In Finland, the impact of net exports on GDP was slightly positive, whereas in Sweden, it was negative. This is explained by the fact that imports contracted more rapidly than exports in Finland in the early stages of the crisis, which turned net exports positive, whereas in Sweden, exports contracted more. However, Sweden’s net exports had kept on developing steadily before the pandemic, and the severe contraction took place specifically during the coronavirus spring. In Finland, in turn, the impact of net exports on GDP has fluctuated more, being sometimes positive, sometimes negative.
Updated statistics on GDP and its sub-items may still change the overall picture of the economic development
It should be observed that the quarterly figures may still be revised, as the statistics are supplemented, and that the figures of the fourth quarter may change the overall picture on the annual level in both countries. The residual, which includes the statistical discrepancy, change in inventories and net acquisition of valuables, is likely to be revised when the statistics are supplemented. The statistical discrepancy will be removed from the supply and use table figures of the final annual national accounts, as demand and supply will be balanced on product group level[5]. Correspondingly, private consumption statistics are expected to be specified when the annual national accounts are completed, as the coronavirus has made it difficult to estimate the production of health services, for example[6]. Based on the preliminary figures, public consumption has contracted in both countries, although they have both increased public expenditure to provide economic stimulus.
The drop in the volume and sub-items of GDP caused by the corona crisis was somewhat more pronounced in Sweden than in Finland at the early stages of the crisis. At the same time, Sweden applied a different strategy to combat the coronavirus, and the epidemic situation was more severe in Sweden. It remains to be assessed how significant an impact the different strategies to combat the virus have had on the real economy.
[1] The preliminary quarterly national accounts data for the third quarter of 2020 were published on 27 November 2020 and may thus be revised later.
Figures of Finland’s quarterly national accounts: Statistics Finland
Figures of Sweden’s quarterly national accounts: Statistics Sweden
[2] Google COVID-19 Community Mobility Reports
[3] Google’s mobility reports include data on how much the number and duration of visits have changed from the beginning of the year in the following categories of places: retail and recreation, supermarkets and pharmacies, parks, public transport, workplaces and residential. The index has been calculated as an average of the listed places with the exception of parks, workplaces and residential. The data has many defects, the most significant one being that it has not been seasonally adjusted.
[4] See also the memo of the Finnish Competition and Consumer Authority on the impacts of coronavirus and related restrictions on mobility (in Finnish).
[5] Statistical discrepancy refers to the difference between the different methods of calculating GDP, i.e. the difference between GDP estimates calculated using the production approach and the expenditure approach.
[6] See the blog post of Hakala and Kuusisto (2020) (in Finnish)